If you regularly watch football you will know the various positions players pick up on the pitch and how players in different positions interact with each other. Positions can be categorised into goalkeeper, defence, midfield and attack, with sub categories for the latter three. In this article we are going to discuss how players in different positions interact with one another, the importance of this on the field, and how physical demands differ from position to position.
The connection among players on the field can be the deciding factor in victory or defeat. Knowledge of how players interact is crucial, not only for understanding one's individual position on the pitch, but also for recognising the positions of teammates and their relevance when needed.

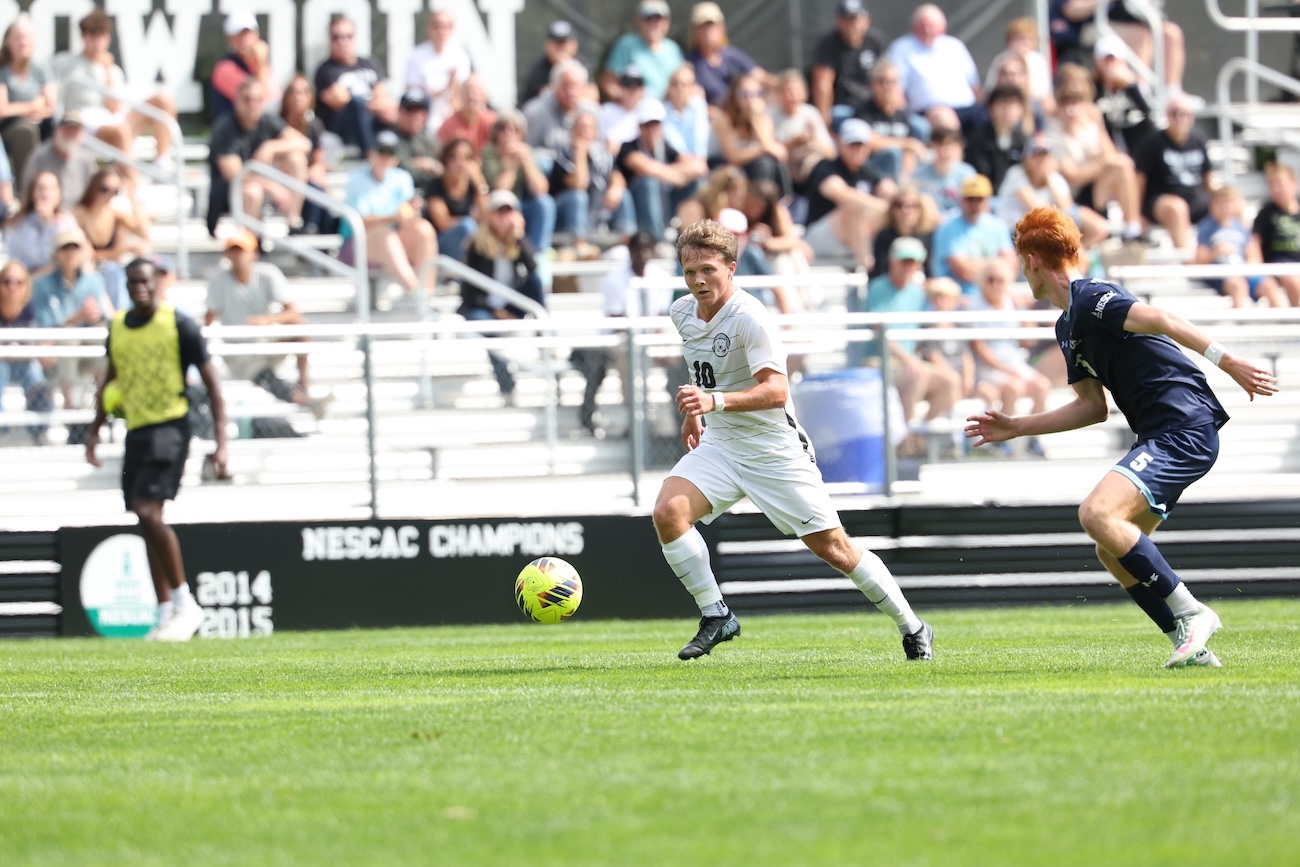
In the image above you can see the various positional areas that players occupy during a game. Depending on the position, the physical demands can differ. A player may be required to cover more ground or perform more sprints and accelerations/decelerations compared to other positions. In a study by (2) data was collected from 7,855 matches played during the 2020 or 2020/21 seasons in 31 leagues from both Europe and America in male professional football (soccer). For outfield players, positions are defined in five modalities: centre backs, full backs, midfielders, wingers and centre forwards. Centre backs are, on average, the players who cover the least distance on the pitch (9.2 km per match), while midfielders cover the most (10.6 km per match). In the 2022-23 Premier League season the top 3 players who covered the most distance were all midfielders, 1 - James Ward-Prowse (433.4km), 2 - Pascal Gross (418.9km), 3 - Declan Rice (412.9km) (3). The average sprint distance or distance covered during high intensity changes, favours footballers playing in wide positions (both defensively and offensively) and forwards.
The results in the table below are adapted from the same study by (2) displaying the average distances of players per match, by position and speed. The total distance covered is highlighted in the first column, followed by the distance covered during high-intensity changes (accelerations/decelerations) and finally the distance covered whilst sprinting.

How each position interacts with one another is key for success. Defenders protect the goal, midfielders act as the engine of the team, linking defence and attack, controlling the flow of the game. Wingers stretch the opposition's defence and deliver crosses into the box, creating scoring opportunities. Forwards, depend on the quality of service from their teammates for opportunities, aim to score and are the first line of defence when not in possession. The cooperation between these positions is crucial, and the best teams will have defence, midfield and attack working together seamlessly. The team must remember that they are a unit working together and that not all the work relies on any one individual. A successful team works well together.
Developing Strategies Through Data Driven Insights
The PlayerData app offers features which allows you to visualise the positions your players occupy during games, enabling you to check if they are sticking to the game plan, or getting dragged into areas they should not be in. Using these features will help visualise how to work better as a team and can provide discussion points for when a change of playstyle is needed. It helps engage the players interest in the game whilst also highlighting potential strengths and weaknesses in formations.

One feature available on the PlayerData app is playback. Playback allows you to see exactly how your team moved throughout an entire match from a birds-eye view. Playback is a great tool to use as a conversation starter among coaches and players. It provides a visual of exactly where individuals were during key moments of a match, such as scoring or conceding a goal. It can also be used as a tool to discuss how players interacted with one another in the build up of play. The playback feature also allows you to see how your team maintained its tactical principles.
The heatmaps feature is another great tool that can be used by coaches to discuss formations with players. Heatmaps provide a visual as to where a player has spent most of their time during the game. The visual offers a colour scale from green to red to highlight how often a player has been in a particular area - green signifies the least amount of time spent in that area, while red signifies the most time spent in that space of the pitch. This can be used as a tool to discuss formations, as they can show how well a player stuck to maintaining their position on the field or if they drifted out of position.

The positional maps feature allows the coaches to view the average position of the player movement on the pitch in relation to their teammates. The coach can filter who they see in the map such as an individual, athlete groups or the entire team. This proves beneficial for visualising their collective performance during games. This process highlights successful team tactics and areas that require improvement.
Adding player positions into the app can help you when comparing positional data. Within the app athletes can be grouped together by position e.g. “forwards” or “defenders”. By doing this, players of a specific position can be grouped together to more easily compare their data. They can also be grouped when looking at the positional maps, making it more accessible to see if players are maintaining their formations. For example, coaches can check to see if defensive players are holding their back line to allow for an offside trap to be played.
Downloading a report after a match or training session gives you an overview of the different metrics recorded for a player or team depending on the type of report selected.
- Summary Report - This shows an athletes load over a period of weeks to help plan for future sessions.
- Session Report - A single session analysis of the team which allows you to compare metrics for all athletes in that session.
- Session Summary Report - This is a multi session analysis that compares metrics over multiple sessions.
- Compare athletes - This is a direct head to head comparison of two athletes.
Conclusion
In conclusion, the dynamic interactions between football positions on the field are the essence of effective team play. From the goalkeeper's role as the last line of defence to the forwards' focus on scoring goals, each position contributes uniquely to the team's overall strategy. Successful football teams thrive on coordinated passing, intelligent movement, and a deep understanding of positional responsibilities. A cohesive unit, where players seamlessly transition between defensive and offensive roles, is more likely to create scoring opportunities and prevent the opposition from doing the same. The beauty of football lies not just in individual skills but in the collective workrate of players to achieve a common goal on the pitch - and the features offered through our PlayerData app allow teams to do just that by providing the resources needed to progress and promote these key positional interactions.
References:
- Ju, W., Doran, D., Hawkins, R., Evans, M., Laws, A. and Bradley, P., 2023. Contextualised high-intensity running profiles of elite football players with reference to general and specialised tactical roles. Biology of Sport, 40(1), pp.291-301.
- Poli, R., Besson, R. and Ravenel, L., 2021. Analysis of the distances covered in professional football competitions.
- Daniel Hepburn, 2023. The 10 PL players who covered the most distance in 2022/23 ft Rice, Kane & Odegaard. Givemesport. Date Accessed: 28/11/2023. Available at: https://www.givemesport.com/the-10-pl-players-who-covered-the-most-distance-in-202223-ft-rice-kane-odegaard/.