The metrics we have used within the PlayerData app have been carefully selected to ensure athletes and coaches can improve and maximise their performance. In this blog, we will discuss the importance of each metric and how, when used collectively, they can benefit performance in both training and matches.

Total Distance
Total distance covered by an athlete is measured slightly differently in a training session compared to a match. In a training session, the total distance is the distance covered over the allocated time of the session. In contrast, in a match session, the total distance is the distance covered during the allocated time and within the pitch boundaries set.
Using the ‘total distance’ metric is an excellent way for both athletes and coaches to monitor athlete load on a weekly basis. Analysing an athlete's historical data from the previous weeks can signal to coaches if an athlete should be rested, e.g. if an athlete is consistently covering high distances, which can ultimately help prevent and reduce athlete burnout and injuries.
Studies show that increasing weekly workload by 15% can raise the risk of injury by 50% for Athletes1. This shows the importance of monitoring any sudden spike in workload. You can monitor these loads week by week by utilising our progress tab.
High-Intensity Distance and Sprint Distance
High intensity distance (HID) is defined as being the cumulative distance covered by an athlete when their speed lies within the “high-intensity running” boundary for at least 0.5 seconds. Sprint distance is defined as the cumulative distance covered by an athlete when their speed lies within the “sprinting” boundary for at least 0.5 seconds.
Examining HID and sprint distances alongside total distance provides insights into the volume and intensity of a session. While total distance is a fundamental metric for gauging session volume, its interpretation becomes more meaningful when considered in conjunction with other metrics. For instance, a scenario where the total distance is high, but top speed is slower than usual with fewer high-intensity runs, or sprints indicates a high-volume session with lower intensity. In contrast, a high-intensity session would showcase more 'high-speed distance' and might feature a lower total distance.
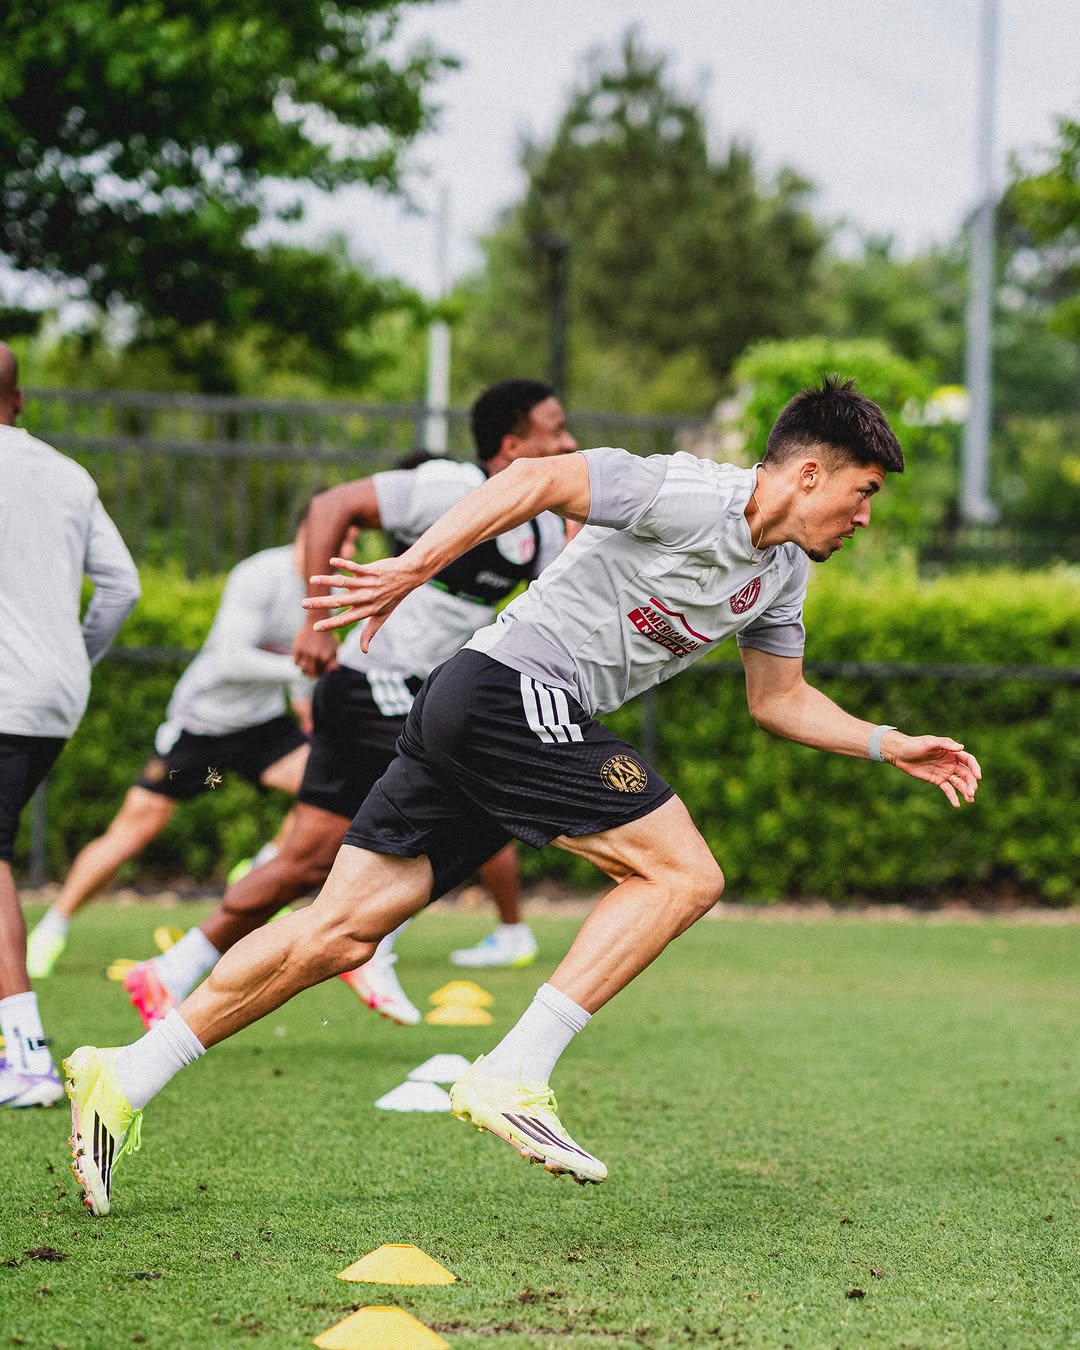
Top Speed
In the PlayerData app, top speed is defined as the player’s peak running speed. This is determined by analysing peak speed data in 0.5 second intervals to capture the maximum value.
There are numerous reasons why tracking top speed in football players is useful:
- Monitoring top speed enables coaches to identify the fastest players on the team. Although many of the fastest players may be easy to identify when training or playing a match, this is usually because they are playing on the wing or as a striker so they have space to express their speed, however seeing the results of the entire team in the app may surprise you with unexpected player’s recording a high top speed. Regardless of the position a player plays in, working to improve top speed is beneficial for improving overall performance levels.
- If a player is tested in a recovered state to gauge their top speed, this can be used as a benchmark to assess their performance during a match or training session. If a player is recording a speed similar to their top speed this usually means they are fresh and fully fit, but if a player is recording a top speed well below their benchmark this can be a sign that something is wrong, perhaps caused by an injury or fatigue. Identifying this early can help spot an emerging injury or save an existing injury from getting worse.
- Measuring top speed also adds enjoyment and a friendly competitive edge to training. Every player wants to be the fastest on the team and having the ability to see your score, gives players a number to aim for and compare to others.
A recent study found that eccentric hamstring strength significantly decreased when 7-8 weekly sprint efforts at max>90% were completed but not at <6 weekly efforts, suggesting that a high volume of intense sprinting may increase the risk of hamstring injury by compromising the strength of the eccentric hamstring muscles2.
The vast majority of sprints performed in football tend to be less than 20m with an average sprint time of 2-4 seconds3,4,5, so it may be difficult for players to reach their top speed in a match scenario. Players tend to perform 8 times as many accelerations as they do sprints2, so it may be beneficial to put more focus on shorter sprints/accelerations in training.
Check out our recent blog for a more in–depth look into risks of injury and injury prevention.
High-Intensity Efforts and Sprint Events
High-intensity “efforts” are counted when an athlete remains within the “high-intensity Running” boundary for at least 0.5 seconds. Sprinting “efforts” are counted when an athlete remains or exceeds the “sprinting” boundary for at least 0.5 seconds.
The significance of monitoring the timing and location of high-intensity and sprinting events lies in enabling the coach to devise drills that specifically target this metric. This, in turn, informs the team when to execute these actions properly, minimising the risk of burnout. Additionally, tracking high-intensity events aids in assessing athlete positioning on the field, providing valuable insights for both the coach and the athlete to ensure correct placement.

Metres per Minute
Metres per minute (m/min) is the metric we use to measure an athlete's work rate over the session. It is an average calculation of the metres run in each minute of a training session or game. For example, if a player has run a total distance of 9500m in a 90-minute game, their metres per minute would be 105.5m (9500/90). This data can showcase how intense the session was and how hard players have worked. Professional players will reach between 90–115 metres per minute in a typical game. To get a more accurate metres per minute from match data, use our match event feature.
Acceleration
How significant is the acceleration metric for a team or individual seeking to improve performance and prevent burnout or injury? It extends beyond simply measuring a player's speed. EDGE units measure when you've increased your speed by 2.5 metres per second (m/s). This metric is vital for evaluating the frequency and timing of accelerations, identifying effective instances and determining whether the athlete is expending energy wisely or requires guidance in this aspect.
This can be a good metric for utilising a high press in soccer or having a good line speed in rugby. This metric is not to be confused with high-intensity or sprint events.
Deceleration
Decelerations stand out as a crucial metric for any player, signifying the highest mechanical load per metre compared to other actions during match-play. This is measured as a decrease in speed of 2.5 metres per second (m/s). Consistently executing decelerations proves challenging, given their frequency, which can be up to 2.9 times more than accelerations. These abrupt changes in direction result in heightened fatigue, impacting a player's capacity to execute technical actions. This fatigue may manifest as increased muscle soreness, diminished jumping ability, and asymmetries in hamstring strength.
Why Use the Metrics Together
Examining these metrics collectively provides valuable insights into how athletes are performing and training. Discussing whether certain athletes cover more distance and intensity than others can lead to fruitful teamwork discussions. This broader awareness of athletes' energy output across sessions or overtime helps pinpoint reasons for fatigue. For instance, if an athlete consistently covers a substantial distance in training but is not doing it during a match, is this due to a lack of effort, or is something else going on? Analysing how often athletes reach their top distances and comparing it to the planned training frequency per week can further enhance this understanding.
These insights allow coaches to deconstruct individual athletes' performances, guiding them to improve their weaknesses. Recognising that each athlete has different weaknesses will allow coaches to tailor a more targeted training plan to improve these weaknesses and help prevent burnout or injury.
These metrics can also serve as a source of encouragement. Demonstrating to athletes that they executed a sprint at a pivotal moment in a match, leading to a team advantage, can significantly uplift their morale. It also creates a competitive environment, which can increase the intensity of sessions or matches as players know they cannot hide as the numbers will not lie.
Consistently monitoring player metrics can help minimise the risk of injury, as abnormal results may highlight an issue. For example, if a player is covering significantly less distance than they usually do, it may indicate that the player is carrying an injury, or there might be other factors at play. Players may hide injuries to avoid missing matches, but the metrics that are recorded can highlight this.
Get the Most From Your Data
Don't forget, all PlayerData team's have access to personalised 1:1 team support with our PlayerData Sports Scientists, available 7 days a week, ensuring you get the most out of your GPS performance trackers. Simply email support@playerdata.com and we'll be happy to help.
References:
- Gabbett TJ.: The training—injury prevention paradox: should players be training smarter and harder?, Br J Sports Med, 50:273–280 2016.
- Shah, S., Collins, K. and Macgregor, L.J., 2022. The Influence of Weekly Sprint Volume and Maximal Velocity Exposures on Eccentric Hamstring Strength in Professional Football Players. Sports, 10(8), p.125.
- Burgess DJ, Naughton G, Norton KI. Profile of movement demands of national football players in Australia. J Sci Med Sport. 2006;9(4):334–341. PubMed doi:10.1016/j.jsams.2006.01.005
- Vigne G, Gaudino C, Rogowski I, Alloatti G, Hautier C. Activity profile in elite Italian soccer team. Int J Sports Med. 2010;31(5):304–310. PubMed doi:10.1055/s-0030-1248320
- Gabbett TJ, Mulvey MJ. Time–motion analysis of small sided training games and competition in elite women soccer players. J Strength Cond Res. 2008;22(2):543–552. PubMed doi:10.1519/JSC.0b013e3181635597
- Varley MC, Aughey RJ. Acceleration profiles in elite Australian soccer. Int J Sports Med. 2013;34(1):34–39. PubMed